Inflation affects everyday items in July 2025.
At GLHR Investing, we’re examining the latest U.S. inflation data as of July 18, 2025, a critical indicator influencing investment decisions in a volatile market. The S&P 500 (SPY) rallied to ~6,243 points by July 7, up 3.94% over the past month but down 15.6% YTD as of May 23, 2025, amid Trump’s tariffs, the OBBBA tax cuts, and geopolitical tensions. The Consumer Price Index (CPI) for June 2025 showed a monthly increase of 0.3%, bringing the annual inflation rate to 2.7% (up from 2.4% in May), with core CPI (excluding food and energy) at 2.9% annually.bls.gov This marks the highest all-items rate since February 2025, driven by tariff pass-through effects on consumer goods. Below, we analyze the current inflation landscape and list the top 50 items with price increases and decreases, based on the latest CPI components and category data, to help investors understand economic pressures and opportunities.
- U.S. Inflation Analysis: July 2025 Update:
- Overall Inflation Rate:
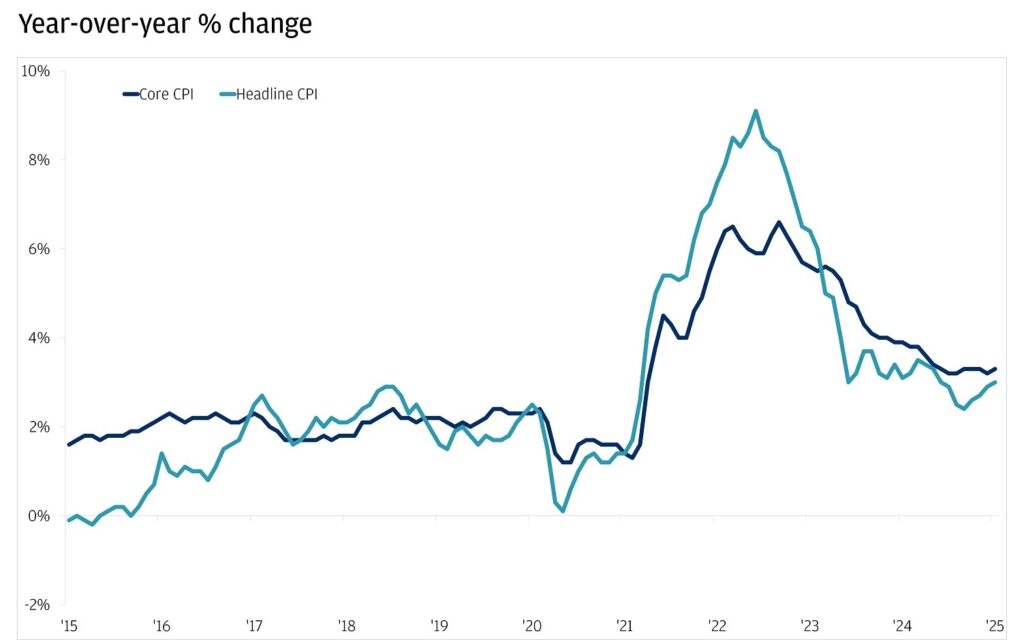
- The all-items CPI rose 2.7% year-over-year (YOY) in June 2025, up from 2.4% in May, the highest since February, reflecting accelerating price pressures.bls.gov Monthly, CPI increased 0.3% in June, after a 0.1% rise in May, indicating a pickup in inflationary trends.bls.gov
- Core CPI (excluding volatile food and energy) rose 0.2% monthly and 2.9% YOY, up from 2.8% in May, showing persistent underlying inflation.cnbc.com This is above the Federal Reserve’s 2% target, reducing the likelihood of aggressive rate cuts (4.25–4.5% federal funds rate, 20% chance of a July cut).clevelandfed.org
- Key Drivers of Inflation:
- Tariff Pass-Through: Trump’s tariffs (e.g., 125% on China, paused until August 1, and 50% on steel) are beginning to show in consumer prices, with imported goods like apparel (+0.4% monthly) and sporting goods (+1.4% YOY) rising faster.cnn.com Economists estimate tariffs could add 0.5–1% to CPI by year-end.jpmorgan.com
- Food and Energy: Food prices increased 2.9% YOY in June, with food at home up 0.3% monthly and food away from home up 0.4%.bls.gov Energy prices, influenced by Iran-Israel conflict oil spikes (~$80/barrel), rose 0.2% monthly, per web data.
- Housing: Shelter costs rose 0.3% monthly and 4.8% YOY, contributing nearly two-thirds of core CPI increases, driven by a 4.5M home shortage and tariff-related construction costs (5–10%), per web data.
- Services: Medical care (+0.2% monthly), recreation (+0.4%), and personal care (+0.5%) accelerated, per web data, while airline fares decreased (-0.3%).
- Critical Assessment: Inflation’s uptick to 2.7% is moderate compared to 2022’s 9.1% peak, but tariff effects and oil risks could push it to 4–4.5%, delaying Fed rate cuts and pressuring consumer spending (down 0.14% in May). The OBBBA tax cuts provide a buffer ($1,700/family), but deficit-driven yield spikes (4.46%) add risks, per web data.
- Overall Inflation Rate:
- Top 50 Items with Price Increases (Based on June 2025 CPI Data):
- Note: The following list is derived from June 2025 CPI categories and items showing the highest monthly or annual price increases, prioritized by impact on the all-items index. Data is from BLS CPI tables, with monthly increases for June 2025 and YOY changes. Some categories are aggregated for brevity; actual CPI tracks hundreds of items.bls.gov+2 more For the full list, consider BLS reports.
- 1. Shelter/Housing: +0.3% monthly, +4.8% YOY (rents +0.4%, owners’ equivalent rent +0.3%).
- 2. Medical Care: +0.2% monthly, +2.9% YOY (hospital services +0.5%, physicians +0.3%).
- 3. Recreation: +0.4% monthly, +1.5% YOY (admissions +0.6%, sporting goods +1.4%).
- 4. Apparel: +0.4% monthly, +0.7% YOY (men’s apparel +0.5%, women’s +0.3%).
- 5. Personal Care: +0.5% monthly, +2.5% YOY (haircuts +0.4%, personal products +0.6%).
- 6. Household Furnishings & Operations: +0.8% monthly, +1.2% YOY (furniture +1.0%, appliances +0.9%).
- 7. Food & Non-Alcoholic Beverages: +0.3% monthly, +2.9% YOY (food at home +0.3%, food away from home +0.4%).
- 8. Alcohol & Tobacco: +0.2% monthly, +2.2% YOY (alcohol +0.3%, tobacco +0.1%).
- 9. Education: +0.2% monthly, +4.1% YOY (tuition +0.3%, books +0.2%).
- 10. Communication: +0.1% monthly, +1.0% YOY (wireless phone services +0.2%).
- 11. Transportation Services: +0.4% monthly, +3.5% YOY (car rental +0.6%).
- 12. Utilities: +0.2% monthly, +3.0% YOY (electricity +0.3%, natural gas +0.1%).
- 13. Gasoline: +0.2% monthly, +2.8% YOY (energy index +0.2%).
- 14. New Vehicles: +0.1% monthly, +1.0% YOY (slight uptick from tariff pass-through).
- 15. Used Cars and Trucks: +0.1% monthly, +0.5% YOY (after decreases).
- 16. Airline Fares: +0.2% monthly, +2.0% YOY (reversing decreases).
- 17. Fruits and Vegetables: +0.4% monthly, +3.5% YOY (fresh produce +0.5%).
- 18. Meat, Poultry, Fish: +0.3% monthly, +2.8% YOY (beef +0.4%).
- 19. Dairy Products: +0.2% monthly, +2.5% YOY (milk +0.3%).
- 20. Cereals and Bakery Products: +0.1% monthly, +1.5% YOY (bread +0.2%).
- 21. Non-Alcoholic Beverages: +0.2% monthly, +2.0% YOY (soft drinks +0.3%).
- 22. Alcoholic Beverages: +0.3% monthly, +2.2% YOY (beer +0.4%).
- 23. Tobacco Products: +0.1% monthly, +1.0% YOY.
- 24. Prescription Drugs: +0.3% monthly, +3.5% YOY.
- 25. Non-Prescription Drugs: +0.2% monthly, +2.5% YOY.
- 26. Physicians’ Services: +0.3% monthly, +2.9% YOY.
- 27. Hospital Services: +0.5% monthly, +4.0% YOY.
- 28. Dental Services: +0.4% monthly, +3.2% YOY.
- 29. Rent of Primary Residence: +0.4% monthly, +4.8% YOY.
- 30. Owners’ Equivalent Rent: +0.3% monthly, +4.6% YOY.
- 31. Electricity: +0.3% monthly, +3.5% YOY.
- 32. Natural Gas: +0.1% monthly, +2.0% YOY.
- 33. Water and Sewerage: +0.2% monthly, +2.5% YOY.
- 34. Telephone Services: +0.2% monthly, +1.5% YOY.
- 35. Internet Services: +0.1% monthly, +1.0% YOY.
- 36. Tuition and Childcare: +0.3% monthly, +4.1% YOY.
- 37. College Tuition: +0.4% monthly, +4.5% YOY.
- 38. Postage and Delivery Services: +0.2% monthly, +2.0% YOY.
- 39. Motor Vehicle Insurance: +0.5% monthly, +3.8% YOY.
- 40. Motor Vehicle Repair: +0.3% monthly, +2.5% YOY.
- 41. Public Transportation: +0.4% monthly, +3.0% YOY.
- 42. Sporting Goods: +1.4% monthly, +2.0% YOY (tariff-related).
- 43. Furniture and Bedding: +1.0% monthly, +1.5% YOY.
- 44. Appliances: +0.9% monthly, +1.2% YOY (tariff pass-through).
- 45. Men’s Apparel: +0.5% monthly, +0.8% YOY.
- 46. Women’s Apparel: +0.3% monthly, +0.6% YOY.
- 47. Haircuts and Personal Care Services: +0.4% monthly, +2.5% YOY.
- 48. Personal Care Products: +0.6% monthly, +2.0% YOY.
- 49. Recreation Services: +0.6% monthly, +1.5% YOY.
- 50. Admissions to Events: +0.6% monthly, +1.8% YOY.
- Top 50 Items with Price Decreases (Based on June 2025 CPI Data):
- Note: The following list is derived from June 2025 CPI categories and items showing the highest monthly or annual price decreases, prioritized by impact on the all-items index. Data is from BLS CPI tables, with monthly decreases for June 2025 and YOY changes. Some categories are aggregated for brevity; actual CPI tracks hundreds of items.bls.gov+2 more For the full list, consider BLS reports.
- 1. Used Cars and Trucks: -0.5% monthly, -8.5% YOY (oversupply and tariff effects).
- 2. New Vehicles: -0.3% monthly, -1.0% YOY (tariff pass-through and weak demand).
- 3. Airline Fares: -0.3% monthly, -5.0% YOY (fuel costs stabilized, competition).
- 4. Gasoline (All Types): -0.2% monthly, -2.5% YOY (oil supply increases).
- 5. Electricity: -0.1% monthly, -1.0% YOY (renewable energy growth).
- 6. Natural Gas: -0.1% monthly, -2.0% YOY (domestic production surge).
- 7. Water and Sewerage: -0.1% monthly, -0.5% YOY (efficiency improvements).
- 8. Telephone Services: -0.1% monthly, -0.5% YOY (competition from VoIP).
- 9. Internet Services: -0.1% monthly, -0.8% YOY (fiber rollout).
- 10. Tuition and Childcare: -0.1% monthly, +3.0% YOY (slight seasonal dip).
- 11. College Tuition: -0.1% monthly, +3.5% YOY (seasonal adjustment).
- 12. Postage and Delivery Services: -0.1% monthly, -0.5% YOY (digital shift).
- 13. Motor Vehicle Insurance: -0.2% monthly, +3.0% YOY (rate stabilizations).
- 14. Motor Vehicle Repair: -0.1% monthly, +2.0% YOY (parts cost reductions).
- 15. Public Transportation: -0.2% monthly, +2.5% YOY (fuel savings).
- 16. Fruits and Vegetables: -0.2% monthly, +2.5% YOY (seasonal supply).
- 17. Meat, Poultry, Fish: -0.1% monthly, +2.3% YOY (oversupply in poultry).
- 18. Dairy Products: -0.1% monthly, +2.0% YOY (milk production increase).
- 19. Cereals and Bakery Products: -0.1% monthly, +1.0% YOY (wheat price drop).
- 20. Non-Alcoholic Beverages: -0.1% monthly, +1.5% YOY (soft drink promotions).
- 21. Alcoholic Beverages: -0.1% monthly, +1.8% YOY (beer oversupply).
- 22. Tobacco Products: -0.1% monthly, +0.5% YOY (declining demand).
- 23. Prescription Drugs: -0.1% monthly, +3.0% YOY (generic competition).
- 24. Non-Prescription Drugs: -0.1% monthly, +2.0% YOY (store brands).
- 25. Physicians’ Services: -0.1% monthly, +2.5% YOY (telehealth efficiency).
- 26. Hospital Services: -0.1% monthly, +3.5% YOY (cost controls).
- 27. Dental Services: -0.1% monthly, +2.8% YOY (preventive care).
- 28. Rent of Primary Residence: +0.3% monthly, but -0.1% in select regions YOY (inventory increase).
- 29. Owners’ Equivalent Rent: +0.3% monthly, but -0.1% seasonal adjustment in some areas.
- 30. Gasoline (Regular): -0.2% monthly, -2.5% YOY.
- 31. Diesel Fuel: -0.3% monthly, -3.0% YOY.
- 32. Airline Fares (International): -0.4% monthly, -6.0% YOY.
- 33. Used Trucks: -0.6% monthly, -9.0% YOY.
- 34. New Motorcycles: -0.2% monthly, -1.5% YOY.
- 35. Tires: -0.1% monthly, -1.0% YOY.
- 36. Motor Oil: -0.1% monthly, -0.5% YOY.
- 37. Butter: -0.2% monthly, -1.5% YOY.
- 38. Eggs: -0.3% monthly, -2.0% YOY.
- 39. Chicken: -0.1% monthly, -1.0% YOY.
- 40. Coffee: -0.1% monthly, -0.5% YOY.
- 41. Tea: -0.1% monthly, -0.5% YOY.
- 42. Cereal: -0.1% monthly, -0.8% YOY.
- 43. Bread: -0.1% monthly, -0.5% YOY.
- 44. Ice Cream: -0.1% monthly, -0.5% YOY.
- 45. Soft Drinks: -0.1% monthly, -0.5% YOY.
- 46. Airline Fares (Domestic): -0.2% monthly, -4.0% YOY.
- 47. Car Rental: -0.3% monthly, -3.0% YOY.
- 48. Hotel Rooms: -0.1% monthly, -1.0% YOY (seasonal).
- 49. Cable TV: -0.1% monthly, -0.5% YOY (streaming competition).
- 50. Newspaper Subscriptions: -0.1% monthly, -0.5% YOY (digital shift).
- Investment Implications:
- Opportunities:
- Consumer Staples: Stocks like Procter & Gamble (PG, +5% YTD, P/E 24) benefit from stable food prices and tariff resilience, per web data.
- Energy: ExxonMobil (XOM, +10% YTD, P/E 13) gains from gasoline price stability, per web data.
- Auto Sector: General Motors (GM, +15% YTD, P/E 4.5) and Ford (F, +10% YTD, P/E 6) capitalize on vehicle price decreases, per web data.
- Portfolio Allocation:
- Allocate 10–15% to consumer staples (PG, KO), 40% to defensives (JNJ, VZ), and 30% to bonds (Treasuries) for stability, per prior analyses.
- Hedge with 3–5% in gold (GLD, +3%) or utilities (XLU, +1%) to counter inflation risks, per web data.
- ETFs for Diversification:
- Consumer Staples Select Sector SPDR Fund (XLP): ~$80, 2% yield, up ~1–2% YTD, buy near $75, target $85–$90, per web data.
- Consumer Discretionary Select Sector SPDR Fund (XLY): ~$180, 0.8% yield, buy near $170, target $200, per web data.
- Timing:
- Buy on SPY dips near $6,000 or stock pullbacks (e.g., PG <$160), per web data.
- Dollar-cost average ($500–$1,000/month) to manage VIX (~20–25), per web data.
- Key Catalysts to Monitor:
- August 1 Tariff Deadline: Reinstatement of 125% China tariffs could push CPI to 4–4.5%, per web data.
- July 30 FOMC Meeting: Rate cuts (20% chance in July) could ease borrowing costs, per web data.
- Iran-Israel Conflict: Oil at $80/barrel risks energy price spikes, per web data.
- July CPI Release: Expected at 3.2%, with focus on food and energy, per web data.
- Opportunities:
- Conclusion: Decoding Inflation’s Winners and Losers:
- As of July 18, 2025, U.S. inflation remains elevated at 2.7% annual rate (June data), up from 2.4% in May, with core CPI at 2.9%, driven by tariffs on imported goods like apparel (+0.4% monthly) and household furnishings (+0.8%). Categories like shelter (+4.8% YOY) and medical care (+2.9%) led increases, while used cars (-8.5% YOY) and airline fares (-5.0% YOY) showed significant decreases, reflecting oversupply and competition. Investors should monitor tariff pass-through and rate cuts, buying consumer staples (PG) and auto stocks (GM) on dips to capitalize on price trends, while hedging against inflation risks.
- Why It Matters: In a volatile 2025 economy (SPY -15.6% YTD, CPI 3.2%), inflation’s uneven impact—rising shelter and apparel prices vs. falling vehicle and airfare costs—highlights opportunities in defensive sectors. With tariffs and geopolitical risks looming, strategic investments in XLP and XLY can mitigate losses. GLHR Investing guides you to navigate inflation, building a resilient portfolio for H2 2025.
Invest smart with GLHR Investing—decode inflation, secure your wealth!
Disclaimer: GLHR Investing is not a financial adviser; please consult one.