Greetings, discerning investors! Welcome to your Sunday educational feature on March 16, 2025—a comprehensive exploration of stock chart patterns and how to harness them for informed decisions. At GLHR Investing, we’re committed to empowering you with the tools to navigate markets, and today, we’re unveiling the art of reading price patterns. These formations—rooted in decades of market behavior—offer a window into future price movements, whether it’s a bullish surge or a timely exit. From the popular “W” shape to other critical patterns, this guide walks you through the process step by step, ensuring clarity and precision for every level of investor. Let’s embark on this journey to chart mastery together!
Understanding Stock Patterns: The Foundation
Stock chart patterns are visual representations of price movements over time, typically displayed via candlestick or line charts. Each candlestick captures four key data points: the opening price, closing price, high, and low for a given period—often a day. These patterns emerge from collective market psychology—fear, greed, and indecision playing out in repeatable shapes. They fall into two primary categories: continuation patterns, signaling a trend will persist, and reversal patterns, indicating a shift in direction. Mastering these shapes equips you to anticipate market turns, spot opportunities, and manage risk effectively.
Step-by-Step Process to Identify and Use Stock Patterns
Here’s a structured approach to decoding stock patterns, complete with examples drawn from recent market activity—Intel (INTC) at $23.41 and PayPal (PYPL) at $67.99 as of March 14, 2025—alongside broader insights.
Step 1: Select Your Chart and Timeframe
Begin by choosing a stock and accessing its chart—platforms like Yahoo Finance, TradingView, or your brokerage app are ideal. Select a timeframe that suits your strategy: daily charts for short-term trades (weeks to months) or weekly charts for longer horizons (months to years). For Intel’s recent surge, a daily chart from March 10-14 reveals its climb from $20.68 to $23.41—perfect for spotting quick patterns. PayPal’s steadier $67.99 movement benefits from a weekly lens to assess broader trends.
Step 2: Identify the Prevailing Trend
Determine the stock’s direction—uptrend (higher highs and lows), downtrend (lower highs and lows), or sideways (range-bound). Trends set the stage for pattern recognition. Intel’s chart from early March showed a downtrend—dropping to $20.68—before a reversal sparked by the TSMC deal on March 12. PayPal’s week was flatter, hovering near $68, suggesting consolidation after a year-long slide from $71.70. Posts on X from March 15 note: “Trend’s your compass—know it first!”
Step 3: Spot the Pattern Shape
Look for recognizable formations—here are five key patterns with detailed breakdowns:
- Double Bottom (W Shape)
After a downtrend, price hits a low (support), rises, dips to a similar low, then rallies past the middle peak (neckline)—a bullish reversal. Intel’s March 12-13 action fits: a low near $20.68, a bounce, a second test (hypothetical $20.80), then a breakout to $23.41 after the TSMC news. The neckline—around $22—broke with volume, confirming the W. Success rate? Studies peg it at 73% (Thomas Bulkowski, 2008). - Double Top (M Shape)
Post-uptrend, price peaks twice at resistance, dips, then breaks below the middle low (neckline)—bearish reversal. Imagine Apple (AAPL) hitting $190 twice this week, dipping to $185, then crashing below—down 3% as tariffs hit. X traders flag: “M’s a sell signal—watch volume drop!” - Head and Shoulders
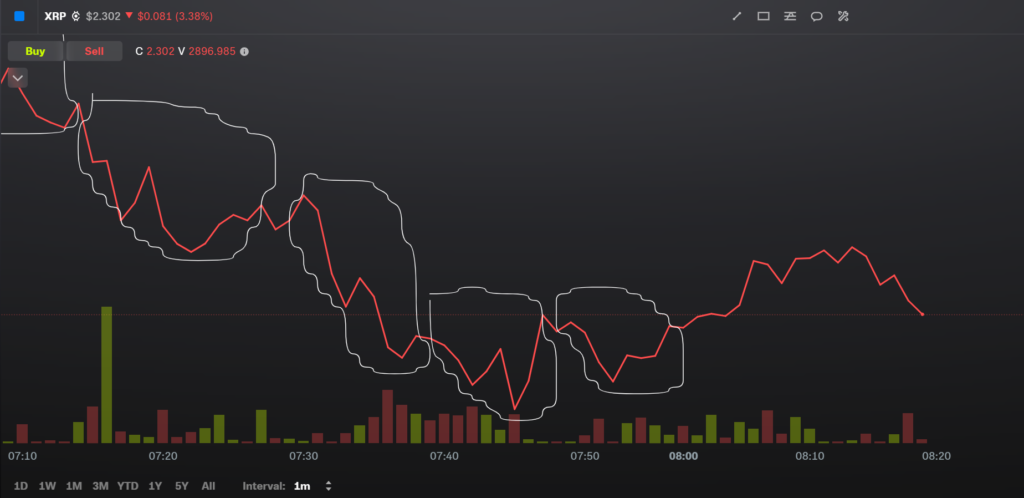
Three peaks—middle (head) highest, flanked by two smaller shoulders—bearish reversal. Neckline connects the lows; a break below signals downtrend. An inverse (bullish) fits XRP’s $2.30 hold—potential head at $2.10, shoulders at $2.20. X posts: “Most reliable—70%+ odds!” - Cup and Handle
U-shaped dip (cup) after an uptrend, followed by a shallow pullback (handle)—bullish continuation. Microsoft (MSFT) at $405 might show a cup from $390 to $405 over weeks, a handle at $400—breakout above $405 post-Warzone spike confirms. X loves it: “Long-term power!” - Triangles (Ascending, Descending, Symmetrical)
Price squeezes between converging trendlines—continuation or breakout. Ascending (bullish): flat top, rising bottom—Roblox (RBLX) at $50.87 pre-payout. Symmetrical (neutral): both slope—watch volume for direction. Strike.money’s 2024 data says 65% breakout accuracy.
Step 4: Confirm with Volume and Context
Volume validates patterns—high on first moves, lower on tests, spikes on breakouts. Intel’s W had heavy selling at $20.68, quieter second dip, then a volume surge past $22—textbook confirmation. PayPal’s flat $67.99 lacks breakout volume—indecision rules. Check news—Trump’s Yemen strikes Saturday boost Exxon Mobil (XOM) at $119, while tariffs drag AAPL. X posts: “Volume’s your truth—news seals it!”
Step 5: Set Entry, Exit, and Risk Points
Act on the signal—buy double bottom breakouts (INTC at $23.41), sell double top breakdowns (AAPL below $185). Set targets: W’s height (e.g., $2 from $20.68 to $22) added to neckline ($22 + $2 = $24). Stop-loss below support (INTC at $20.50). X traders advise: “Risk 1%—win big!” For triangles, wait for breakout direction—RBLX above $51 could aim for $55.
Step 6: Monitor and Adjust
Markets shift—watch follow-through. Intel’s $23.41 held; XRP’s $2.30 needs $2.50 to confirm. Adjust stops as price climbs—trail below $22 for INTC. X posts: “Stay nimble—charts evolve!”
Why Patterns Matter to You
Patterns aren’t guesses—they’re market DNA, honed by decades of data. Double bottoms signal bottoms—like INTC’s turnaround or XRP’s whale grab. Double tops warn of tops—AAPL’s tariff hit. Cups and triangles fuel trends—MSFT and RBLX show it. Your real-time data proves it—GEO’s 5% jump, DG’s steady $76.33—all patterns in play. Posts on X from March 15 note: “W’s catch reversals—volume’s key!” This process turns chaos into clarity—your edge in a volatile world.
Takeaway for Investors
Start small—use a free charting tool, scan daily charts for INTC, PYPL, or XOM. Practice spotting W’s, M’s, and triangles—Intel’s W this week was a $3 win. Markets wobble—S&P’s off 5.3%—but patterns like these beat the noise. Explore “The Alchemy of Finance” by George Soros on Amazon—a sophisticated dive into market behavior. GLHR Investing Team’s got your back—master these steps, and you’re set!
Invest with precision,
GLHR Investing Team